Eğitim
How to highlight the lowest value in Excel
Welcome to Microsoft Excel Training!
When working with Microsoft Excel, you might have a table of sales data. To find and highlight the smallest value in this range, we typically use Conditional Formatting. Conditional formatting can be thought of as a kind of “automatic” formatting that applies only when a certain condition is met. Without conditional formatting, you’d have to highlight each value manually.
Let’s start by finding the smallest value using Conditional Formatting:
- First, select your sales data range.
- Go to the Home tab.
- Click on Conditional Formatting → Top/Bottom Rules → Bottom 10 Items.
- Change the number from 10 to 1 to highlight just the single smallest value.
- Choose a formatting style (e.g., green fill).
This will immediately highlight the smallest value within your selected range.
However, what if you want to highlight not just the cell, but the entire row that contains the smallest value? In this case, the standard conditional formatting method doesn’t work directly. Instead, we’ll use the New Rule option:
Here’s how:
- Clear any previous conditional formatting rules by selecting the entire range and choosing Conditional Formatting → Clear Rules → Clear Rules from Entire Sheet.
- Select your data range again (excluding headers).
- Go to Conditional Formatting → New Rule.
- In the New Rule window, select “Use a formula to determine which cells to format.”
- In the formula box, enter the following formula (assuming your data starts from cell B2):
=$B2=MIN($B$2:$B$10)(Use F4 or Fn + F4 to fix references properly with dollar signs.) - Click Format, set your desired formatting (for example, white bold text with a green fill), and confirm with OK.
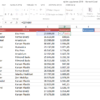
Now, Excel automatically highlights the entire row containing the smallest sales value. For instance, if the smallest value changes due to data entry, Excel will immediately adjust the highlight to the new smallest value.
By using the New Rule option, you can also easily identify the largest or smallest values, highlighting the full row for clear and efficient data analysis.


